
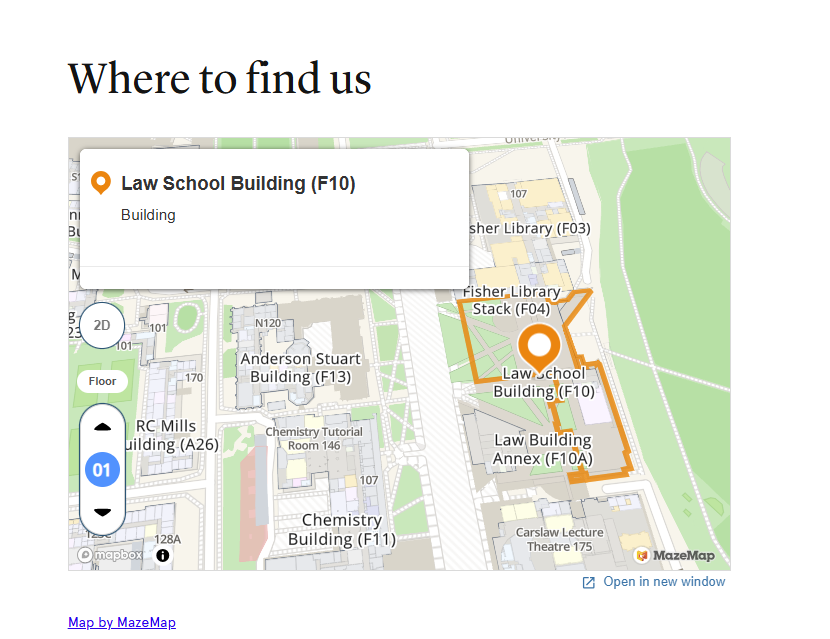
Venue: Law School Building Annex (F10A)
Access to the New Law Building is via Eastern Avenue (main entrance)
All sessions are scheduled in Lecture Theatre 101, except where indicated.
Day 1
10 November
Day 2
11 November
Day 3
12 November
Downloadable pdf version of the program is available here
Prof Dingxuan Zhou, Head of School, School of Mathematics and Statistics
Prof Kate Jolliffe, Associate Dean Research, Faculty of Science
Plenary – Veridical Data Science towards Trustworthy AI
In this talk, I will introduce the Predictability–Computability–Stability (PCS) framework for veridical (truthful) data science, emphasizing its central role in generating reliable and actionable insights. I will present success stories from cancer detection and cardiology, where PCS principles have guided cost-effective study designs and improved outcomes. Because trustworthy uncertainty quantification (UQ) is essential for trustworthy AI, I will then focus on PCS-based UQ for prediction in regression and multi-class classification. PCS-UQ follows three steps: prediction check, bootstrap, and multiplicative calibration. Across 26 benchmark datasets, PCS-UQ outperforms common conformal prediction methods in interval width, subgroup coverage, and subgroup interval width. Notably, the multiplicative calibration step in PCS-UQ can be viewed as a new form of conformal prediction. I will conclude with a discussion of PCS-guided constructive approaches for building more trustworthy statistical models, along with available PCS resources.
Bin Yu
UC Berkeley
Explainable AI Systems Must Be Contestable: Here’s How to Make It Happen
As AI regulations around the world intensify their focus on system safety, contestability has become a mandatory, yet ill-defined, safeguard. In XAI, “contestability” remains an empty promise: no formal definition exists, no algorithm guarantees it, and practitioners lack concrete guidance to satisfy regulatory requirements. Grounded in a systematic literature review, this paper presents the first rigorous formal definition of contestability in explainable AI, directly aligned with stakeholder requirements and regulatory mandates. We introduce a modular framework of by-design and post-hoc mechanisms spanning human-centered interfaces, technical architectures, legal processes, and organizational workflows. To operationalize our framework, we propose the Contestability Assessment Scale, a composite metric built on more than twenty quantitative criteria. Through multiple case studies across diverse application domains, we reveal where state-of-the-art systems fall short and show how our framework drives targeted improvements. By converting contestability from regulatory theory into a practical framework, our work equips practitioners with the tools to embed genuine recourse and accountability into AI systems.
Elevating Compliance Intelligence: A Human–Machine Model for Incident Analysis
As regulatory demands increase, particularly in high-risk sectors such as con-struction, mining, and manufacturing, traditional compliance systems are struggling to keep up with the growing volume and complexity of incident data. Although AI adoption is on the rise, many compliance processes still focus on documenting inci-dents rather than learning from them. Reports often describe what happened but overlook deeper analysis of why and how it occurred. In this study, we introduce a human–machine collaborative model that integrates machine learning, natural language processing, and expert judgment to enhance compliance intelligence. Using Australian case studies, we compare three approach-es to incident analysis: manual review, clustering with word embeddings, and auto-mated classification with large language models (LLMs). Each method is evaluated for consistency, scalability, and ability to generate predictive insights. A key focus of our study is the comparison between OpenAI models and LLMs in incident classification scalability. OpenAI models require manual review of generat-ed outputs, with analysts manually verifying and documenting cause and mechanism details;na process that limits efficiency and scalability. In contrast, LLMs automate pattern recognition and classification, significantly reducing human intervention while refining accuracy through active learning cycles. By integrating LLMs into the data pipeline, we observed accelerated compliance analysis with improved con-sistency across large datasets. In a pilot study, we applied an LLM to classify 200 historical compliance records. The results closely aligned with manual assessments, demonstrating strong potential for real-world application. However, human oversight remains essential. While LLMs can process large volumes of data quickly, human experts play a crucial role in interpreting complex cases and ensuring contextual accuracy. This hybrid approach enables faster, more confident decision-making and shifts compliance from reactive reporting to proactive safety management. By treating incident data as a strategic asset, organisations can detect patterns earlier, respond more effectively, and build more resilient systems. The findings suggest that lever-aging LLMs instead of OpenAI models provides greater scalability, automation, and analytical depth, ultimately enhancing compliance intelligence and risk mitigation.
Large language models for interdisciplinary communication in bioinformatics
Interdisciplinary collaboration is fundamental in data science. In bioinformatics, it involves collaboration between health and life science experts and quantitative scientists. However, presenting analysis for complex high-dimensional bioinformatics data often poses challenges in communication. With the promise of large language models (LLMs), we investigate their potential to aid interdisciplinary communication. In this study, we benchmarked four state-of-the-art LLMs: GPT-4o, o1, Claude 3.7 Sonnet and Gemini 2.0 on their ability to assist with interpretation and communication of bioinformatics analyses. We conducted both automated and human evaluations of the LLM-generated interpretable reports from bioinformatics analyses. Automated assessment employed multiple-choice questions to assess whether key information from the original analysis has been retained in the report. This revealed an accuracy of around 60%. In human evaluations, we tasked experts to score reports for factual consistency, lack of harmfulness, comprehensiveness, and coherence. While the generated reports by all models are readable and largely safe, we identified frequent misinterpreted visualisations, verbose summaries and a lack of novel insights beyond what was already reported in the analytics. These findings indicate that LLMs are best suited as aids to facilitate interdisciplinary communication by offering accessible summaries of complex analytics. Human oversight remains essential to ensure accuracy, interpretation, and development of novel scientific insights.
Extracting Extreme Precipitation pathways using External Coefficient and K-means++ Clustering Algorithm
Extreme precipitation events are increasing in frequency, causing significant social and economic losses in a global scale, underscoring the need for a comprehensive understanding of their mechanisms to improve disaster preparedness and mitigation strategies. This study focuses on the spatiotemporal dependency analysis of extreme precipitation, which is vital to deciphering the complex behavior of these events. In this work, we introduce a new approach to extract valuable information about extreme precipitation pathways and homogeneous extreme precipitation regions. Moreover, we utilize the extreme values concurrence coefficient as the input of the K-means++ algorithm to capture the extreme precipitation pathways with different lead lags using satellite-based precipitation products to cover land-ocean extreme precipitation pathways. The outcomes of this study will be valuable to water resources management, natural hazards preparedness, and climate research.
Using auxiliary information to separate measurement error from microscale variation in hierarchical spatial statistical models
The nugget effect in continuous spatial data is, in general, a combination of measurement error (from imperfect scientific instruments) and microscale variation (variability inherent in the spatial process at infinitesimal spatial scales). In hierarchical spatial statistical models, the former belongs in the data model and should be filtered out when inferring the latent spatial process, but, if present, the microscale variation belongs in the process model and should not be filtered out. Separating one from the other usually requires modelling assumptions or, preferably, investigations of the properties of the measuring process through, for example, duplicating the measurements of some samples. In this presentation, I develop Bayesian and frequentist methods to exploit different kinds of auxiliary information about the measuring process to distinguish between measurement error and microscale variation in hierarchical spatial statistical models. This includes situations where some duplicated measurements are available directly, and situations where one only sees summary statistics (min, mean, max) of the absolute relative differences between duplicate observations or the absolute relative error calculated from measurements of a ground-truth reference sample. These methods are assessed and compared in a simulation study. Analysis of a real-world dataset of zinc concentrations in the soil of a floodplain of the Meuse River in the Netherlands suggests that measurement error accounts for only a small fraction of the nugget effect in these spatial data, highlighting the need for careful investigation of the measuring process.
Computational modelling of black swan bioterror events
The foot-and-mouth disease (FMD) virus is one of the most contagious animal pathogens in the world, spreading via direct contact, contaminated objects, and over the air. FMD is present in many countries across Asia, the Middle East, Africa and South America with recent outbreaks in neighbouring Indonesia. An outbreak in Australia could inflict economic damages of up to A$80 billion, primarily from loss of export markets. The detection of FMD on a farm will lead to the entire herd being culled. Mass culling and disposal of carcasses has deep financial, social and environmental impacts. The wilful introduction of FMD virus into an FMD-free country such as Australia is a plausible act of bioterrorism. FMD infected hosts and contaminated material are accessible in endemic countries and the virus can remain infectious for long periods on inanimate objects. The lag between infection and the appearance of clinical signs provides a window for a perpetrator to disappear well before detection and official investigation. The Australian Animal Disease Spread (AADIS) model is essentially a flight simulator for epidemiologists and is in use by Governments in over 20 countries. AADIS stochastically generates millions of different disease outbreak possibilities and lets users experiment with response tactics. The model occasionally generates black swan outbreaks that balloon up to catastrophic size. The intentional triggering of a black swan outbreak by a bioterrorist would maximise damage to a targeted country. My presentation will include a dynamic demonstration of the AADIS model and show how it is used by animal health authorities to prepare for, and respond to, outbreaks of emergency animal disease. AADIS can also be used to research black swan outbreaks and assist with preparedness and response for high-impact bioterrorism events.
Inferring Viral Clearance and Extinction Dynamics with Hybrid Simulation-Based Inference
Inferring Viral Clearance and Extinction Dynamics with Hybrid Simulation-Based Inference
Optimising data utilisation in federated learning: combined frameworks for horizontally and vertically partitioned data
Introduction and Motivations In today’s era of big data, the drive for incorporating diverse, voluminous datasets from multiple sources has led to transformative challenges and opportunities in machine learning. This study applies a previously developed combined federated learning framework [1] to a real-world clinical problem: the prediction of 5-year survival outcomes using the METABRIC breast cancer dataset [2]. This framework is designed to support learning across data that is both horizontally and vertically partitioned which enable multi-institutional collaboration and maintaining data privacy. Traditional federated learning algorithms [3] have focused primarily on scenarios where data is either horizontally [4] or vertically [5] partitioned to preserve privacy by avoiding data centralization. However, in real-world settings, data is often split across different institutions or devices such that some entities hold different subsets of samples (horizontal partitioning) and others possess complementary features for the same samples (vertical partitioning). The aim of this work is to demonstrate the effectiveness of a combined federated learning framework in predicting 5-year survival outcomes from horizontally and vertically partitioned clinical data. Data Incorporation The dataset used in this study is the METABRIC breast cancer clinical dataset [2] which contains information on 2,509 patients and includes a wide range of clinical, pathological and molecular variables. A series of pre-processing steps were applied to ensure data consistency and suitability for neural network-based federated learning. Patient records with missing values in the outcome feature were excluded. For categorical variables (i.e., those with a data type of object), missing entries were imputed using the most frequent value (mode) within each column and numerical features (including age, tumour size, mutation count, and lymph node involvement) were imputed using the median value to reduce sensitivity to outliers. After imputation, all categorical variables were encoded using integer-based label encoding which assigns a unique integer to each category. Following pre-processing, 26 input features and 1917 data points were retained for modelling. To reflect a realistic federated learning setting, the dataset was horizontally partitioned across three simulated hospital sites with each holding approximately one-third of the patient records and the complete set of input features. In contrast, the outcome variable was stored in a registry node for all patients. Besides hospitals and a registry, there is a third party, Server, involved to aggregate the intermediate results. This distribution setup mimics a real-world healthcare scenario where hospitals maintain control over patient-level feature data and a central cancer registry maintains survival outcome records. Methods A fully connected feedforward neural network was used as the underlying machine learning model for this study. The network architecture consisted of an input layer corresponding to the number of features (26), followed by two hidden layers with 64 and 32 neurons respectively, each utilizing ReLU activation function [6]. The final output layer consisted of a single neuron for binary classification. The model was implemented using PyTorch, with binary cross-entropy loss having a sigmoid activation [7] and the Adam optimizer [8] set with a learning rate of 0.001. The data at each hospital was split into an 80:20 ratio, with 80% used for training and 20% reserved for local testing to evaluate model performance and the federated training was conducted over 100 communication rounds. During each training round, each hospital independently computed the linear transformation of the first layer of the neural network on its local data and sent the intermediate outputs to the server. The server aggregated these outputs and applied the non-linear activation function (ReLU) before forwarding the result to the registry. The registry continued the forward pass through the subsequent layers, computed the loss using the ground truth labels and performed backward propagation. The gradient of the loss with respect to the outputs of the first hidden layer was then sent back to the hospitals via the server to allow them to locally update their parameters. This process was repeated until the model converged to local minima. For benchmarking purposes, a centralized learning setup was also implemented where all data was aggregated into a single location and trained using the same neural network architecture. Results The model achieved an accuracy of 92.69% on the combined training data which indicates strong convergence and effective learning across the distributed system. In the validation set, the model achieved an accuracy of 68.49%. These results support the feasibility of applying the combined federated learning framework to clinical outcome prediction tasks using real-world data. The observed performance gap between training and validation is consistent with typical supervised learning scenarios and may reflect natural variability in patient characteristics and outcome complexity. The centralized model produced results (accuracies and convergence rate) identical to those of the federated setting. This outcome is expected as both settings use the same underlying mathematical model and training process, differing only in data distribution and privacy-preserving workflow. References [1] A. Anees, M. Field, L. Holloway, Development of federated learning neural networks with combined horizontal and vertical data partitioning, Available at SSRN 4851066. [2] C. Curtis, S. P. Shah, S.-F. Chin, G. Turashvili, O. M. Rueda, M. J. Dunning, D. Speed, A. G. Lynch, S. Sama- rajiwa, Y. Yuan, et al., The genomic and transcriptomic architecture of 2,000 breast tumours reveals novel subgroups, Nature 486 (7403) (2012) 346–352. [3] S. Banabilah, M. Aloqaily, E. Alsayed, N. Malik, Y. Jararweh, Federated learning review: Fundamentals, enabling technologies, and future applications, Information processing & management 59 (6) (2022) 103061. [4] W. Huang, T. Li, D. Wang, S. Du, J. Zhang, T. Huang, Fairness and accuracy in horizontal federated learning, Information Sciences 589 (2022) 170–185. [5] A. Anees, M. Field, L. Holloway, A neural network-based vertical federated learning framework with server integration, Engineering Applications of Artificial Intelligence 138 (2024) 109276. [6] C. Banerjee, T. Mukherjee, E. Pasiliao Jr, An empirical study on generalizations of the relu activation function, in: Proceedings of the 2019 ACM Southeast Conference, 2019, pp. 164–167. [7] S. Narayan, The generalized sigmoid activation function: Competitive supervised learning, Information sciences 99 (1-2) (1997) 69–82. [8] Z. Zhang, Improved adam optimizer for deep neural networks, in: 2018 IEEE/ACM 26th international sympo- sium on quality of service (IWQoS), Ieee, 2018, pp. 1–2.
Impacts of AI on the Scientific Ecosystem
Artificial Intelligence, in both predictive and generative forms, is increasingly being adopted to support — and in some cases, entirely perform — scientific research. In this talk, I will discuss both the significant opportunities that AI brings to science and the questions that AI raises for science. The talk will be grounded in some of my own work in use cases including biocuration and literature-based discovery, as well as ongoing work exploring the limitations of LLMs, that may have particular impacts in the scientific arena.
Karin Verspoor
RMIT
Towards precision medicine: assessing chromosomal instability in High Grade Serous Ovarian Cancer with shallow whole genome sequencing
Cancers are driven by two genomic alterations: point mutations or copy number changes, also called chromosomal instability (CIN). High Grade Serous Ovarian Cancer (HGSOC) is driven by CIN, but to date, cancer treatments have focused on mutations. So there has been no change in front-line treatment or cure rates in HGSOC for 20 years, despite improvements in progression-free survival from maintenance therapy with PARP inhibitors (PARPi). In 2024, 1805 Australian women were diagnosed with ovarian cancer. 1070 women died from it. Lowering costs now allow clinical assessment of CIN. Foundational work using shallow whole genome sequencing (sWGS) identified two HGSOC subtypes: tumours with homologous recombination deficiency (HRD) which can be responsive to PARPi and the remainder for which no additional treatment beyond standard therapy has been devised (Homologous Recombination Proficient, HRP). Our work in the BritROC-1 study identified variation within both groups which could benefit from more tailored treatments [1,2]. To extend this work, we amassed the OTTA dataset of 1800 samples with our international collaborators to further study the heterogeneity uncovered in BritROC-1. Each sWGS sample is assessed using chromosomal signatures identified by feature engineering, mixture modelling and non-negative matrix factorization. Results show more structure in HGSOC than the accepted HRD/HRP dichotomy. We examine differences between the ovarian-specific signatures developed by MacIntyre1 and the more recent 17 pan-cancer signatures [3]. [1] Macintyre et al Nat Genet 50 1262 2018 [2] Smith et al Nat Commun 14 4387 2023 [3] Drews et al Nature 606 976 2022
Improving Brain Injury Diagnosis from 3D CT Scans Using Residual Triplet Deep Learning
Mild Traumatic Brain Injury (mTBI) is a prevalent yet diagnostically challenging condition. Early and accurate detection is vital to guide treatment and improve patient outcomes. However, traditional diagnostic methods often lack sensitivity and reliability. In this work, we propose a novel deep learning framework that leverages 3D Computed Tomography (CT) data and metric learning to enhance diagnostic accuracy. Our approach employs a Residual Triplet Convolutional Neural Network (RTCNN) trained using a triplet loss function to learn discriminative embeddings of 3D CT scans. This design enables the model to effectively distinguish mTBI cases from normal scans by optimizing the spatial distance between similar and dissimilar cases in feature space. The RTCNN achieves strong diagnostic performance, with an average accuracy of 94.3%, sensitivity of 94.1%, and specificity of 95.2%, validated via five-fold cross-validation. Compared to a standard Residual CNN, the RTCNN improves specificity by 22.5%, accuracy by 16.2%, and sensitivity by 11.3%—all while using fewer memory resources, making it a resource-efficient solution. To enhance interpretability, we employ occlusion sensitivity maps, offering visual insights into the model’s decision-making process. This work demonstrates a clinically meaningful and computationally efficient tool for supporting early mTBI diagnosis using 3D imaging.
Leveraging LLMs for Qualitative Research: Workflow Architecture and Evaluation
Traditional qualitative analysis is often time-consuming, labor-intensive, and difficult to scale, especially when working with large volumes of unstructured text. We propose a workflow that leverages large language models (LLMs) to support researchers perform qualitative analysis in a more scalable and resource-efficient way. Using techniques from natural language processing, such as prompt engineering, iterative querying, and output validation, the goal is to guide LLMs to identify themes that enable humans in the loop for interpretive analysis.
Various LLMs are compared and the workflow is built around the desired model(s) with domain-specific prompting strategies to better emulate the contextual reasoning and pattern recognition typically involved in qualitative research. A case study will compare the LLM-generated themes with those developed by human coding teams to assess alignment in coverage, interpretability, and depth.
The study provides empirical data on whether LLM-assisted workflows can reduce the time and resource demands of thematic analysis while maintaining analytical rigor. The approach could offer a practical and scalable tool for researchers and practitioners in fields such as social sciences, policy analysis, and user research.
(Supervisor – Dr Antonette Shibani)
Empowering researchers through national initiatives
The Sydney Informatics Hub (SIH) is a Core Research Facility dedicated to working with the University of Sydney research community to maximise the value and impact of data. It provides researchers with access to a team of software engineers, statisticians, data scientists, high-performance and cloud computing experts to support their research through advice, training and dedicated project delivery. What is less well-known, however, is that SIH also leads the University of Sydney’s contribution to a range of National Collaborative Research Infrastructure Strategy (NCRIS) initiatives. These include creating and leveraging platforms for language and text data analysis, geospatial, agricultural and ecological data processing at scale, and reusable bioinformatics and genomics pipelines. In this session, I’ll describe how University of Sydney researchers and colleagues from Australian institutions can engage with these initiatives: testing them out, shaping their development and adapting them for their research. National Platforms showcased will include: – Language Data Commons of Australia (LDaCA, ARDC) – Curated Collections – Digital Humanities Collections Builder (ARDC) – Australian Plant Phenomics Network (APPN) – Australian BioCommons
Shaping the Future of Australia’s Digital Health Research Infrastructure
Dr Bernadette Hyland-Wood
Prof Divya Mehta
Working Lunch: Shaping the Future of Australia’s Digital Health Research Infrastructure – Law Seminar Room 100
Early career researchers are driving innovation at the interface of data, health, and technology, but what do YOU need most to accelerate discovery and translation? This interactive session, open to all ADSN delegates, hosted by QUT, Curtin University, UTS and ARDC, in partnership with the Australian Research Data Commons (ARDC), invites participants to share their experiences, challenges, and aspirations for national-scale analytics infrastructure in digital health. Through facilitated discussion and collaborative mapping, we’ll explore: 1) What datasets and analytic tools (AI and non-AI) are you currently using? 2) What gaps in access, interoperability, and trusted data environments exist? 3) What are your priorities for new ARDC-supported tools, data resources, and translation pipelines? Please join us to shape the next generation of Australia’s digital health data and research ecosystem, from foundational infrastructure to real-world impact.
Dr Bernadette Hyland-Wood,
Prof Divya Mehta,
Dr Alberto Nettel-Aguirre,
Dr Gnana Bharathy
Pooled and Joint Clustering of Multiple Datasets with Applications to Flow Cytometry
In the analysis of multiple datasets objective comparisons of cluster patterns are required to detect changes that have occurred over time, to discriminate between datasets from different underlying distributions—such as healthy and diseased—and to find variables connected with the change. With an increasing number of variables in biological and biomedical applications, good methods are required to provide efficient and reproducible solutions to these problems. Doherty et al (2025) distinguish between three regimes for clustering multiple datasets and comparing their cluster patterns: pooling, meta-clustering and joint clustering and review model-based clustering approaches with applications to flow-cytometry. However their regimes have much wider applicability including non-parametric models and more general fields of application. We explore properties of the three regimes from the perspective of simultaneous clustering and comparison of multiple datasets and examine how common clustering methods fit into these regimes. Our comparisons include the newer t-SNE and Multi-SOPHE, our extension of the histogram-based SOPHE, which also allows for active variable selection which enhance differences between cluster patterns from different underlying distributions. We illustrate the results with HIV data and larger Cytomegalovirus (CMV) datasets. References 1. Conran, L. Koch, I., Turlach, B., and Zaunders, J. (2025). Multi-SOPHE, a Joint Clustering and Variable-Selection Approach with Applications to Flow Cytometry Data, Preprint. 2. Doherty, U. P., McLoughlin, R. M., & White, A. (2025). Challenges and Adaptations of Model‐Based Clustering for Flow and Mass Cytometry. Wiley Interdisciplinary Reviews: Computational Statistics, 17(1).
A multi-objective optimisation strategy for biomarker selection with restriction
Selecting biomarkers is a critical step in the development of precision medicine. Existing approaches typically focus on selecting biomarkers based on a single criterion, such as F1 score, accuracy, and the area under the curve (AUC). While this optimises the predictive performance of models, it fails to address practical constraints. These may include limitations of diagnostic platforms, (e.g., allowing only 3 or 4 markers); challenges related to patent robustness in a commercial setting, where competitors can easily substitute biomarkers to bypass patent protection; or specific clinical requirements, such as achieving a given sensitivity and specificity. To address these issues, we proposed a multi-objective optimisation strategy, which aims to balance key performance factors (e.g., AUC), clinical constraints (e.g., diagnostic platform size) and the risk of patent infringement. In particular, we formulated patent-related constraints as objectives that maximise the gap in predictive performance (e.g., accuracy) between the selected and unselected biomarkers, ensuring that the panel cannot be easily replicated without a significant drop in performance. We evaluated our proposed strategy on a melanoma scRNA-seq dataset and considered various optimisation methods, including exhaustive search, single-objective evolutionary method, and simulated annealing. Performance was assessed using multiple metrics, including hypervolume and multi-objective performance error.
Identifying Interface-Enriched Features Between Spatial Domains with FrontiR
State-of-the-art spatial omics technologies enable high-resolution profiling of cells within their native tissue context, allowing for the identification of spatial domains or niches which have shared molecular or cellular characteristics. The interface between spatial domains, where functionally different regions meet, often harbour key biological signals ranging from paracrine signalling, cell state transitions, to tissue remodelling and barrier functions. These interface specific processes orchestrate tissue development, maintain homeostasis and when dysregulated, underlie disease. Motivated by the need to identify these signals in a systematic and interpretable way, here we introduce FrontiR. FrontiR first estimates domain topology by computing local spatial densities, then models how spatial features such and gene expression and cell type proportions change at the interface where domain densities intersect. FrontiR is a flexible framework designed to suit a wide range of experimental designs utilising generalised linear mixed effects models for multi-sample analysis and standard linear models for single sample analysis. When applied to early mouse embryonic development, FrontiR identifies genes responsible for the compartmentalisation of developing brain tissue. Moving forward we will use FrontiR to map how interactions between renal structures are implicated in driving chronic kidney disease. By mapping inter domain spatial signalling, FrontiR provides a systematic approach to link tissue architecture to healthy tissue organisation and disease progression.
A Multimetric Framework for Informative Region Detection in Spatially Resolved Omics Data
Histology images are foundational in pathology, allowing clinicians to assess tissue architecture and diagnose diseases such as cancer. While histology provides rich spatial context, it is low resolution. Spatial transcriptomics (ST) addresses this limitation by measuring gene expression across tissue sections leading to higher resolution information. A key challenge in histopathology is identifying regions of interest (ROIs) that capture meaningful spatial and molecular variation. This allows for the selection of ROIs from histology slides for ST sequencing as sequencing the whole slide is prohibitive due to high cost. We present a generalizable framework for ROI detection that generates and integrates multiple heterogeneous features to characterise local tissue regions. These features include cell density, gene expression levels, and neighbourhood diversity. To select the most informative ROI, we introduce a multi-objective genetic algorithm that scores ROIs based on customizable criteria including spatial coherence, information density, and redundancy. This enables users to adapt the method to specific biological questions or experimental goals by tuning the weighting of each criterion. We demonstrate the utility of our approach on breast cancer ST data, where we identify ROIs that exhibit distinct transcriptional signatures and structural organisation. Overall, our framework provides a quantitative, and customisable strategy for uncovering complex spatial patterns in spatial omics data.
ClustSIGNAL: a method for cell-type spatial clustering of molecule-resolved spatial transcriptomics data
With the increasing uptake of high-resolution, imaging-based spatially resolved transcriptomics (SRT) technologies, which profile gene expression and transcript locations, it is crucial to develop unsupervised analytical methods for extracting unbiased cell-type composition and spatial distribution in biological samples. Clustering SRT datasets is challenging due to data sparsity, caused by drop-out events from true biological variations or technical limitations, as well as differences in cell arrangement within tissues, with homogeneous regions containing a single cell-type or heterogeneous regions with multiple cell-types. To address data sparsity, gene expression of cells is often averaged across a fixed neighbourhood size. However, such naïve approaches assume that these neighbourhoods are homogeneous, which is often inaccurate. Here, we introduce ClustSIGNAL, a clustering method that leverages spatial and cell diversity information to perform adaptive smoothing for improved cell classification. We show the robustness of our adaptive smoothing-based clustering compared to no-smoothing and complete-smoothing-based clustering across multiple simulated datasets and stress test scenarios. On four real-world datasets of varying sizes (up to a million cells), ClustSIGNAL performs multi-sample clustering and identifies more refined clusters with higher accuracy than other spatial clustering methods. We find that ClustSIGNAL balances stabilizing gene expression of similar cells in homogeneous tissue regions while preserving distinct patterns of different cells in heterogeneous regions. ClustSIGNAL R package is available in Bioconductor at bioconductor.org/packages/clustSIGNAL.
Tackling the Complexities of Electronic Healthcare Records with LLMs
Generative AI, with LLMs being the poster child, is transforming our society right before our eyes. The technology landscape is rapidly evolving with huge advances in model capabilities. In this talk, I will present some of the R&D work we do at Oracle Health and AI, highlight some of the challenges we face, and dive into a recent work on how we leverage LLMs to tackle the medical coding task, while discussing similarities and differences with academic research.
Yuan-Fang Li
Oracle Health and AI, Monash University
An automated workflow for improved mine-site safety
The Curtin Institute for Data Science has created an automated workflow for BHP Iron Ore which improves safety whilst minimizing costs associated with validating drill patterns in the open pit mining process. BHP had an existing program to automate their drill pattern planning, execution, and validation, involving semi-autonomous drill-rigs and drone-provided image and LIDAR data. However, validating the planned drill patterns still required a lot of manual work. By the end of this project, our automated workflow removed the need for large amounts of human interaction, and reduced the validation and reporting time to 2 minutes per site (down from multiple hours). This project demonstrates many of the key factors for success when engaging in data science projects involving industry partners and involved a lot of learning from both teams.
Process Voids: Data Science Without Data
In our era of networked computing, organisations generate vast amounts of data, put to use in various ingenious ways with the tools of data science. It is easy, in these conditions of data abundance, to get the impression that high quality data is straightforwardly available for almost anything. As any working data scientist would know, this is not the case. Veritas [1] has estimated that 78% of data stored in organisations is either unread or trivial, and unread data is usually not immediately usable either. In addition, data is often missing entirely, or consists of isolated data oases without straightforward links to one another. There are various names for this phenomenon, including dark data [1], [2] and data silos [3]. In our research, we study how organisations operate using computational models of their processes. We build these models using digital audit trails left behind by interactions between process, people and technology. These digital trails record what has been done, by whom, for whom and when it has been completed. This family of data science tools comes under the topic of process mining [4], [5]. Process mining helps identify bottlenecks, prompt process redesign, and ensure compliance with regulations. Our research group has run applied process mining projects and helped many different organisations improve what they do, including in finance, healthcare, and supply chain logistics. Often we studied complex processes that span across multiple teams and systems, and which are not straightforwardly observable. These organisations inevitably have gaps and inconsistencies in the data they record, and these may well correspond to the processes they want to improve. The challenge is then how to deploy data analytics in conditions of imperfect and incomplete data. We term these regions of missing (process) data process voids. In this talk, we discuss identifying, visualising, and navigating process voids by combining analytics with other information, based on our work in multiple Australian organisations on data-driven process innovation. People in an organisation are always experts in their own work. By modelling expert understanding of an organisation’s behaviour, we can combine data from process analytics with interview-based expert knowledge, and open the way to systematic analysis and quantification of process voids. These integrated, expert-in-the-loop process analytics and visualisations allow insights not possible using data science tools in isolation. It also helps leaders plan an enterprise data strategy that bridges gaps, creates links, and establishes a data-driven understanding of their end-to-end processes. Lastly, it highlights that data science is not just about uncovering facts that were previously unknown, but collaboratively creating concepts that an organisation uses to explain itself and shape its future [5]. References [1] Veritas, “The UK 2020 Databerg Report Revisited,” 2020. [2] D. J. Hand, Dark data: Why what you don’t know matters. Princeton University Press, 2020. [3] R. Jain, “Out-of-the-box data engineering events in heterogeneous data environments,” in Proceedings 19th International Conference on Data Engineering (Cat. No.03CH37405), Mar. 2003, pp. 8–21. doi: 10.1109/ICDE.2003.1260778. [4] W. M. P. van der Aalst, Process Mining: Data Science in Action, 2nd ed. Berlin Heidelberg: Springer-Verlag, 2016. doi: 10.1007/978-3-662-49851-4. [5] W. M. Van Der Aalst and J. Carmona, Process mining handbook. Springer Nature, 2022. [6] K. Erwin, M. Bond, and A. Jain, “Discovering the language of data: Personal pattern languages and the social construction of meaning from big data,” Interdisciplinary Science Reviews, vol. 40, no. 1, pp. 44–60, 2015.
Real-World AI: Transforming Magnetic Plug Inspections
Predictive maintenance is a key challenge in heavy industry, and the assessment of magnetic plug wear is an important but time-consuming process. The Magnetic Plug Computer Vision (MagPlug CV) project, a collaboration between Curtin Institute for Data Science (CIDS), the ARC Training Centre for Transforming Maintenance through Data Science, and our industry partner, aims to automate the detection and rating of magnetic plug wear using deep learning. We developed an end-to-end computer vision pipeline that first localises plugs in field images using a YOLOv11-based detector, followed by deep learning models (EfficientNet, ShuffleNet, and others) to classify plug wear severity on a five-point scale. Our approach addressed major data quality challenges, including inconsistent field ratings, class imbalance, and variation in image quality, through rigorous data cleaning, specialist re-annotation, and targeted data augmentation. Iterative model training and benchmarking across multiple data batches culminated in robust models capable of reliably identifying “significant wear” cases with up to 100% recall in blind testing. The project demonstrates the practical value of cross-disciplinary collaboration and highlights lessons learned in industrial data science, such as the critical importance of data consistency and clear rating criteria for AI-driven maintenance solutions.
Jinman Kim
Dimitri Perrin
Helen Gardner
Willem Vervoort
Yuan-Fang Li
Living on the Edge: AI-enabled prototype camera trap for real-time decision making in the field
Background: Feral pigs pose a significant ecological and agricultural threat, but management is often hindered by the remote, off-grid locations they inhabit. The lack of reliable power and network connectivity in these areas makes cloud-based AI processing impractical. This creates a critical need for a solution that can perform all computation locally—”on the edge”—by running a highly efficient image recognition algorithm on resource-constrained hardware. The primary challenge was to develop a system that could operate autonomously for extended periods while delivering the real-time performance necessary for effective trapping. Action: An AI-enabled intelligent trapping system was developed utilising small single board computers (Raspberry Pi 5). This hardware was chosen for its relatively low power consumption to processing power, small footprint and community for open source development. However, limited CPU, GPU, and RAM presented significant computational constraints alongside time constraints and access to data for training. To overcome this, the development focused on developing a novel method for creating a dataset from existing datasets to create a lightweight yet robust algorithm from pre-existing best-in-class algorithms. The base model (PyTorch Wildlife, Microsoft) was fine-tuned using a small training set from camera traps in similar environments. A key performance benchmark was set to achieve a total compute time of under 5 seconds from image capture to decision, ensuring the system could react quickly enough to be effective. The research team faced a battle of computation time, performance and power consumption of the hardware in an uphill battle to find a viable solution. Results: The approach yielded an optimised algorithm that successfully balanced accuracy with on-device performance. The final model achieved an approximate accuracy of 0.91 and a precision of 0.94. This high level of precision was critical for the goal of preventing the capture of non-target wildlife by minimising false positives. Proof-of-concept field trials near Armidale, NSW, successfully validated the system’s efficacy. Initial challenges with minor delays between detection and trap activation were resolved by refining internal communication protocols. Subsequent trials resulted in the successful trapping of feral pigs, confirming that the optimised algorithm and integrated hardware performed effectively under real-world pressures. Conclusion: The project successfully demonstrated a carefully optimised AI algorithm running on low-power edge hardware that is scalable and could provide an efficient for feral pig management. This marks a significant advancement in automated, ethical pest control. Future development will focus on improving the model development with larger datasets, utilising AI-accelerators to enhance model performance and reduce power consumption and enhanced telecommunications to improve the system’s robustness and applicability in diverse remote environments.
Silent Forests: Using Acoustic AI to Detect Bushfire Impact on Bird Populations in Australia
Birdsong is a vital indicator of ecosystem health, and its absence can signal ecological distress. This project explores the use of acoustic monitoring and machine learning to detect bushfire impacts on native bird populations in Australia. By collecting audio data from open-source field recorders or bioacoustic datasets, we train audio classification models to recognise bird species and quantify changes in acoustic activity. A significant drop in vocalisation patterns after a fire event may reflect habitat destruction or displacement. Coupled with spatial and temporal visualisation, this approach provides a scalable, non-invasive method for tracking wildlife recovery, informing conservation decisions, and guiding bushfire response in vulnerable ecological zones. Furthermore, when integrated with environmental data such as temperature, wind, and vegetation dryness, changes in bird vocalisation may contribute to early warning systems and fire risk prediction frameworks.
Smart Diagnosis of Brain Tumors Using Lightweight Convolutional Architectures for Real-Time Medical Imaging
Early and accurate diagnosis of brain tumors improves the clinical results and facilitates personalized treatment. Traditional radiological workflows is dependent on manual evaluation of MRI scans which faces challenges about scalability, consistency, and speed as imaging data increases in volume and diversity. To enhance the diagnosis process and address this problem, a deep learning framework for smart brain tumor diagnosis is proposed, wherein an optimized version of YOLOv12 is exploited for solving the problem in real time while maintaining high accuracy with computational efficiency. The proposed framework is trained on a real dataset of 10,280 multi-class MRI images corresponding to various brain tumor types, ranging from gliomas to meningiomas and pituitary adenomas. These are systematically split into training (7,196), validation (1,542), and testing (1,542) subsets that robustly generalize. The base grade YOLOv12 architecture has undergone several state-of-the-art innovations including Dynamic ConvNet Backbones, Adaptive Multi-Scale Feature Fusion (AMFF), and Cross-Domain Attention Modules (CDAM) in localizing precise tumor regions and classifying images thereof. With decoupled head layers, neural architecture search (NAS) optimized modules, and anchor-free detection included in the enhancements, the model becomes even more flexible and higher-performing. The training uses AdamW optimizer with a learning rate equal to 0.001429, an input image having resolution of 640 × 640 pixels, and an eventual batch size of 16 for 50 epochs. Despite its minimalist nature, with merely 2.6 million parameters and 6.3 GFLOPs, the YOLOv12 reaches an astonishing 92.9% mean Average Precision (mAP) state of the art mAP which is accuracy wise better than several deeper and heavier baselines, also considering model size and inference speed. Checks via attention-heatmaps and segmentation overlays have shown that detection has occurred robustly across tumor types, sizes, and possibly contrast conditions, with hardly any false positives and crisp boundary localization. This study shows the effectiveness of combining efficient architecture design with domain specific optimization for medical imaging tasks. The proposed YOLOv12-based system shows strong potential for real-time integration into automated MRI diagnostic pipelines, clinical decision support tools, and intraoperative systems especially in settings where computational resources are constrained. Our findings contribute to the advancement of scalable, interpretable, and trustworthy AI solutions in biomedical data science.